Which Counties Should Talarico Focus On?
By Anuj Misra
March 4, 2026
Last night, Texas Congressman James Talarico defeated Congresswoman Jasmine Crockett in the Texas Democratic primary for the Senate race. Meanwhile, the incumbent Senator John Cornyn will face Texas Attorney General Ken Paxton in a Republican primary runoff election on May 26th. As I wrote last week, if more Democrats than Republicans voted in the primary, it would be the first in a midterm election since 2002. While the results are still coming in and the tallies are not finalized, if the numbers in the screenshots below hold, then Democratic turnout will have been about 3 to 4% higher than Republican turnout.
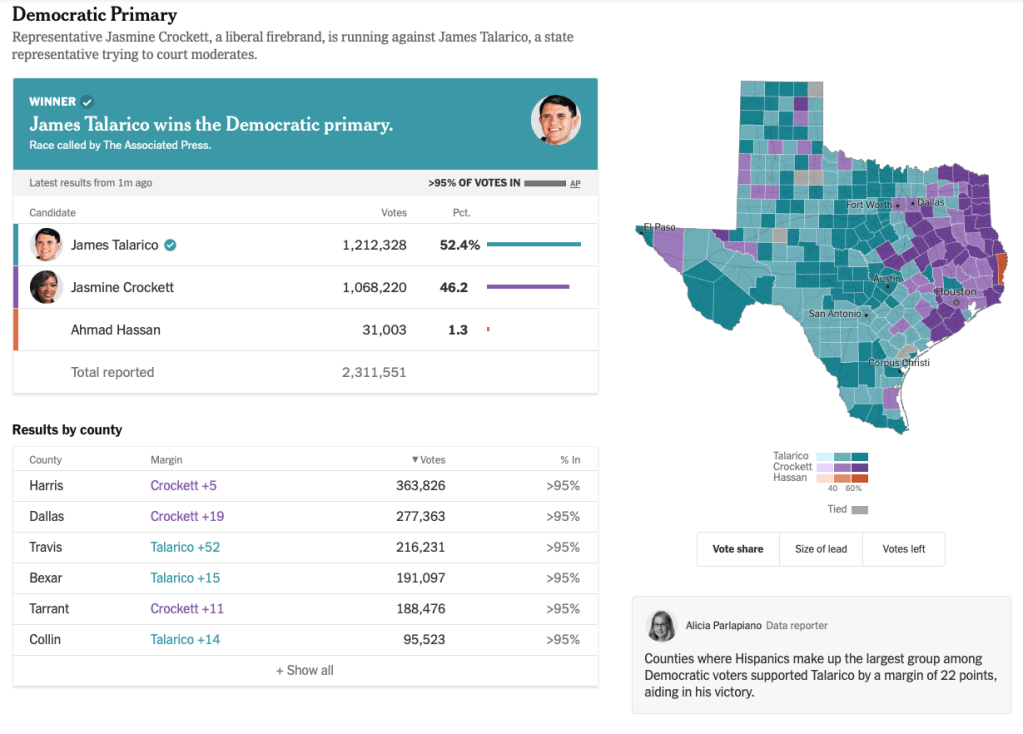
Figure 1. Screenshot of Democratic Primary Results from New York Times at 4:24 PM CST on 3/4/26
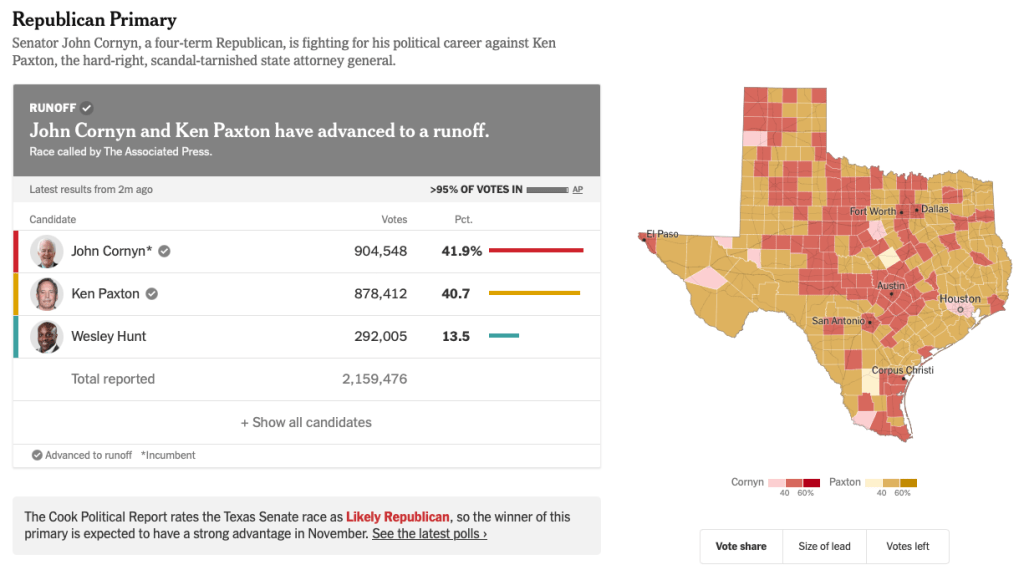
Figure 2. Screenshot of Republican Primary Results from New York Times at 4:24 PM CST on 3/4/26
So, now it is time to ask the more important question. What does Talarico need to do, to become the first Democrat to win a U.S. Senate race in Texas since Lloyd Bentsen in 1988? The simple answer is that he needs to do a lot, and he needs a lot to work in his favor. Conventional wisdom suggests that he has a better shot at beating Paxton than Cornyn, because incumbents traditionally have an advantage. If Paxton is the nominee, it would also be his first election since his 2023 impeachment. In other words, Talarico would be running against the man who he voted to impeach.
Winning Back Texas Latino Voters
Another question that many Democrats have is where Talarico needs to allocate his resources. In the 2010s, many Democrats became excited about the prospect of Texas becoming a swing state, especially due to the rise in the Latino population. While Mitt Romney won Texas in the 2012 presidential election by 16 points, he lost the Hispanic vote by 44 points.[1] Afterward, many Republicans realized that they needed to make inroads in the Latino community. Then Donald Trump surprised many Americans when he launched his 2016 presidential campaign, taking a heavy aim at Mexico and “its people” and calling for a wall along the Mexican border that Mexico would pay for.[2] Many Republicans were concerned that such rhetoric would only further alienate the Latino voters who they were struggling to win over. However, Trump won the presidency in 2016, and he gained ground among Latinos, despite narrowing his margin into the single digits in Texas. In the 2020 election, he gained even more ground among Latinos while his margin slimmed even more in Texas. And in 2024, he outright won the Texan Latino vote, and he won Texas by the largest margin since Romney’s 2012 win.[3] While many Republicans have been worried about Texas slipping away, many Democrats are now realizing that it is practically impossible to lose both the Hispanic and non-Hispanic white vote and still win Texas.
Presidential Election Results in Texas Since 2000
| Year | GOP Candidate | Democratic Candidate | GOP % | Democratic % | Margin |
| 2000 | George W. Bush | Al Gore | 59% | 38% | 21% |
| 2004 | George W. Bush | John Kerry | 61% | 38% | 23% |
| 2008 | John McCain | Barack Obama | 55% | 44% | 11% |
| 2012 | Mitt Romney | Barack Obama | 57% | 41% | 16% |
| 2016 | Donald Trump | Hillary Clinton | 52% | 43% | 9% |
| 2020 | Donald Trump | Joe Biden | 52% | 46% | 6% |
| 2024 | Donald Trump | Kamala Harris | 56% | 42% | 14% |
Figure 3. Presidential Election Results in Texas Since 2000
However, one piece of good news for Talarico is that not all Latinos for Trump are straight ticket Republican voters. In the 2016 presidential election, Hillary Clinton won 9 of the 14 counties along the Texas-Mexico border, and she won all 8 which had a population over 10,000 and a Hispanic majority of 80% or more, as shown in Figure 4. In 2020, Trump managed to flip 2 of those counties, but Biden still held on in the counties with 50,000 or more people, albeit by much slimmer margins. In 2024, Trump flipped 5 of the remaining 6, winning every border county except for El Paso and rural Presidio County. Meanwhile, Democratic Congressman Colin Allred still managed to win the 4 largest border counties with 250,000 or more people in the adjacent Senate race, because of split ticket voters. However, the border counties have trended extremely Republican since Trump first took office, and it will be very difficult for Talarico, or any Democrat to match Clinton’s 2016 margins anytime soon.
Winners in Presidential and Senate Elections in Border Counties Since 2016
| County | 2020 Population[4] | Pct. Latino | 2016 President | 2018 Senate | 2020 President | 2020 Senate | 2024 President | 2024 Senate |
| Hidalgo | 870,781 | 92% | Clinton +40 | O’Rourke +38 | Biden +17 | Hegar +16 | Trump +3 | Allred +7 |
| El Paso | 865,657 | 83% | Clinton +43 | O’Rourke +49 | Biden +36 | Hegar +33 | Harris +15 | Allred +20 |
| Cameron | 421,017 | 89% | Clinton +33 | O’Rourke +26 | Biden +13 | Hegar +14 | Trump +6 | Allred +4 |
| Webb | 267,114 | 95% | Clinton +52 | O’Rourke +43 | Biden +23 | Hegar +27 | Trump +2 | Allred +9 |
| Starr | 65,920 | 98% | Clinton +60 | O’Rourke +54 | Biden +5 | Hegar +16 | Trump +16 | Cruz +2 |
| Maverick | 57,887 | 95% | Clinton +56 | O’Rourke +44 | Biden +9 | Hegar +16 | Trump +18 | Cruz +3 |
| Val Verde | 47,586 | 80% | Clinton +8 | O’Rourke +5 | Trump +10 | Cornyn +11 | Trump +27 | Cruz +16 |
| Zapata | 13,889 | 94% | Clinton +33 | O’Rourke +26 | Trump +5 | Hegar +11 | Trump +22 | Cruz +6 |
| Brewster | 9,546 | 42% | Trump +5 | O’Rourke +7 | Trump +4 | Cornyn +6 | Trump +13 | Cruz +9 |
| Presidio | 6,131 | 81% | Clinton +37 | O’Rourke +47 | Biden +33 | Hegar +35 | Harris +30 | Allred +31 |
| Hudspeth | 3,432 | 64% | Trump +21 | Cruz +11 | Trump +35 | Cornyn +27 | Trump +47 | Cruz +41 |
| Kinney | 3,129 | 47% | Trump +33 | Cruz +39 | Trump +44 | Cornyn +45 | Trump +51 | Cruz +42 |
| Jeff Davis | 1,996 | 31% | Trump +23 | Cruz +18 | Trump +22 | Cornyn +22 | Trump +21 | Cruz +19 |
| Terrell | 760 | 49% | Trump +34 | Cruz +39 | Trump +47 | Cornyn +49 | Trump +55 | Cruz +52 |
Figure 4. Winners in Presidential and Senate Elections in Border Counties Since 2016
Blanket Margin Changes
When thinking about how a candidate like Talarico can win, it is tempting to imagine a blanket margin change. In other words, because Trump won the 2024 presidential election by 14%, the question often becomes, what if every county voted 14% more Democratic? In Figure 5, we have a map with 4 colors for counties.
The red and maroon counties voted for Trump by a margin greater than 13.7%, which is the margin that Trump won the state of Texas by in 2024. In the maroon counties, the margin was greater than 50%.
The blue counties are the ones which Vice President Harris won in 2024.
The purple counties are the ones which Trump won by a margin of less than 13.7%. The conventional wisdom behind a blanket margin change is that Talarico could win Texas if he flips these counties blue.
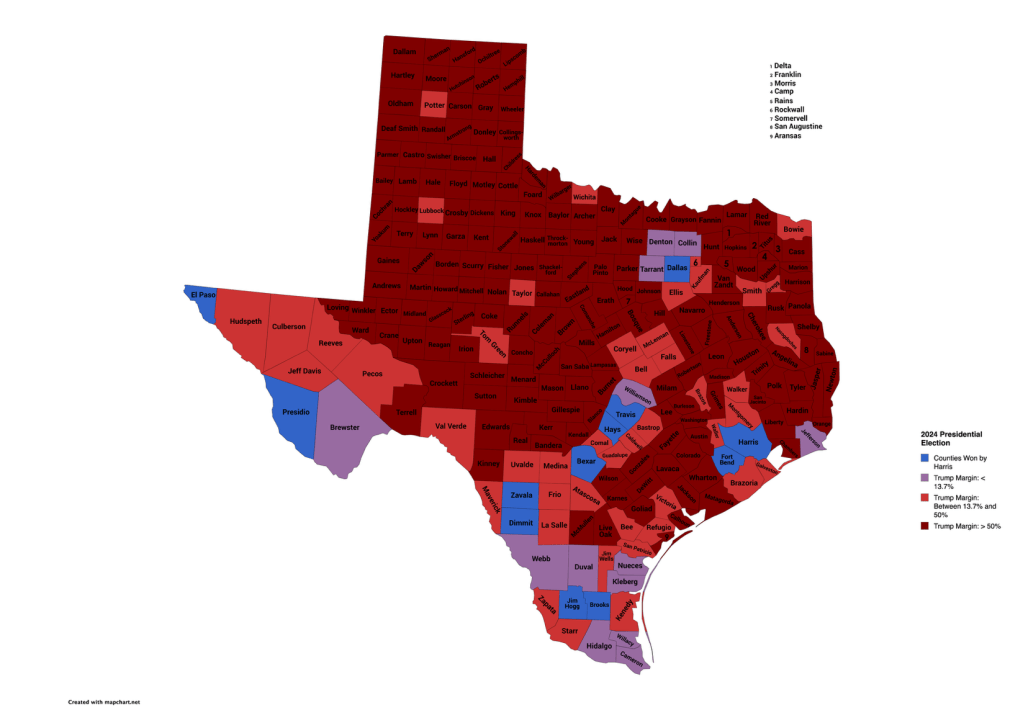
Figure 5. 2024 Presidential Election Results in Texas (map created by MapChart)
Much of what we see in the map is quite intuitive. If Talarico wants to do better than Harris, then he almost certainly needs to start out by winning the 12 counties that she won, and he needs to increase his margin in each, especially in the larger counties where there are more votes. Then he needs to win in more places, and the 13 purple counties are where we look next. Allred won 7 of these 13 counties in the 2024 Senate race as did Biden in the 2020 presidential election, which should inspire the Talarico campaign. However, it is important to remember that the popular vote is all that matters in this race. Unlike presidential elections, there is no electoral college gain if he flips counties, but it is still good to know where the purple counties are.
Purple Counties in Texas
| County | Population | Largest City | Last Democratic Win in Presidential Election |
| Tarrant | 2,110,640 | Fort Worth | 2020 |
| Collin | 1,064,465 | Plano | 1964 |
| Denton | 906,422 | Denton | 1964 |
| Hidalgo | 870,781 | McAllen | 2020 |
| Williamson | 609,017 | Round Rock | 2020 |
| Cameron | 421,017 | Brownsville | 2020 |
| Nueces | 353,178 | Corpus Christi | 1996 |
| Webb | 267,114 | Laredo | 2020 |
| Jefferson | 256,526 | Beaumont | 2012 |
| Kleberg | 31,040 | Kingsville | 2016 |
| Willacy | 20,164 | Raymondville | 2020 |
| Duval | 9,831 | San Diego | 2020 |
| Brewster | 9,546 | Alpine | 2008 |
Figure 6. List of purple counties
The Metroplex
Dallas[AM1] County has been blue since the 2008 election, and Tarrant County went blue for Biden in 2020, for the first time in 1964. It flipped back to Trump in 2024, but it is very much in play for Talarico this year. Talarico also needs to make major gains in the next 2 largest counties in the Metroplex: Collin and Denton. While they used to be solidly red and have not voted Democratic in a presidential election since Texas native Lyndon B. Johnson was on the ballot in 1964, the counties have grown and become increasingly diverse.
The Valley
As mentioned earlier, Allred proved in 2024 that there are Latinos for Trump in The Valley who will still split their ticket and vote for other Democrats. Talarico needs to appeal to these voters, so he can flip back the key counties in The Valley, specifically Hidalgo and Cameron counties. Willacy County would be nice too, and he should visit Raymondville, but he really needs to win big in Brownsville and McAllen and not let them slip away any further. The same applies further up in Laredo.
Urban Areas
While a 14-point blanket margin increase from the 2024 presidential election would flip Texas for Talarico, it is unrealistic to expect a blanket margin change across all counties. An overwhelming 183 of the 254 counties in Texas voted for Trump by a 50-point margin or higher, as shown in Figure 5. However, those 183 counties collectively only accounted for 17% of the total vote count in Texas, as shown in Figure 7.
Number of 2024 Voters by County Margin Thresholds
| Threshold | Counties | Votes Cast | State Proportion |
| Counties won by Harris | 12 | 4,499,775 | 40% |
| Trump Margin: <= 13.7% | 13 | 2,728,445 | 24% |
| Trump Margin: Between 13.7% and 50% | 46 | 2,232,813 | 20% |
| Trump Margin: > 50% | 183 | 1,927,641 | 17% |
| Total | 254 | 11,388,674 | 100% |
Figure 7. Number of 2024 Voters by County Margin Thresholds
A more realistic approach is to focus on Democratic turnout and gains in urban areas, because margin changes in large counties carry much greater weight. As a matter of fact, over half of Texas voters in 2024 came from just 8 counties. Because this is a midterm election, it is unlikely that we will see the same level of turnout, but even minor shifts in large counties can have a major impact, as shown in Figure 8. While a 1% shift may have little effect in a rural county with fewer than 1,000 voters, a 1% shift in Harris County is over 15K votes. Talarico will need to run up the margin in Houston, because a 5-point win will not be sufficient to offset his losses in red counties. Additionally, Talarico will need to boost turnout along the border. As a matter of fact, the only 2 large counties that had turnout below 50% were El Paso and Hidalgo, both border counties where Vice President Harris greatly underperformed.
Counties with > 200K Votes Cast in 2024 Presidential Election
| County | Largest City | 2024 Margin | Turnout | Votes Cast | 1% of Votes |
| Harris | Houston | Harris +5 | 58% | 1,557,484 | 15,575 |
| Dallas | Dallas | Harris +22 | 58% | 849,872 | 8,499 |
| Tarrant | Fort Worth | Trump +5 | 63% | 823,312 | 8,233 |
| Bexar | San Antonio | Harris +10 | 59% | 758,323 | 7,583 |
| Travis | Austin | Harris +39 | 63% | 581,276 | 5,813 |
| Collin | Plano | Trump +11 | 69% | 515,585 | 5,156 |
| Denton | Denton | Trump +13 | 68% | 449,188 | 4,492 |
| Fort Bend | Sugar Land | Harris +2 | 65% | 362,524 | 3,625 |
| Williamson | Round Rock | Trump +2 | 69% | 308,469 | 3,085 |
| Montgomery | The Woodlands | Trump +45 | 57% | 307,258 | 3,073 |
| El Paso | El Paso | Harris +15 | 48% | 251,569 | 2,516 |
| Hidalgo | McAllen | Trump +3 | 49% | 217,265 | 2,173 |
| Counties: >= 200K Voters | Harris +4 | 61% | 6,982,125 | 69,821 | |
| Counties: 30K to 200K Voters | Trump +34 | 62% | 2,842,176 | 28,422 | |
| Counties: < 30K Voters | Trump +57 | 63% | 1,564,373 | 15,644 | |
Figure 8. Counties with > 200K Votes Cast in 2024 Presidential Election
When we look at Figure 8, we also see that these urban counties collectively had over 4 times the number of voters than all the rural counties (< 30K voters) combined. In fact, Harris County alone had almost as many voters as the rural counties. This means that if Talarico can increase the margin by more than 14 points in the urban counties, then he has less work to do in the rural counties which will overwhelmingly vote Republican. However, he still will need to do plenty of work in midsized counties, and hopefully for him, some of those gains may trickle down to the rural counties, as shown in Figure 9. For example, if he increased margins by 18% in urban counties, 9% in midsized counties, and 3% in rural counties, that would narrowly put him over the top.
Weighted Blanket Margin Increases
| County Size | Total Trump | Total Harris | Raw D Margin | Blanket Margin Increase | Projected Raw D Margin |
| >= 200K Voters | 3,277,027 | 3,585,404 | 308,377 | 18% | 1,565,160 |
| 30K to 200K Voters | 1,893,692 | 919,481 | -974,211 | 9% | -718,415 |
| < 30K Voters | 1,222,878 | 330,365 | -892,513 | 3% | -845,582 |
| Net Total | 6,393,597 | 4,835,250 | -1,558,347 | 1,163 |
Figure 9. Weighted Blanket Margin Increases
Limitations
Although it is more realistic to think in terms of weighted blanket changes as opposed to overall blanket margin changes, there are numerous caveats with any type of grouping. Figure 9 also does not account for the fact that turnout will be lower and vary across all counties this year, because it is a midterm election. Each of the 254 counties in Texas is unique, and you simply cannot compare Houston to Dallas or Austin, or midsized cities like Lubbock to Laredo. They are each starting from different margins and are likely to have different increases, largely due to different demographics. Over the next couple of months, I will try to create a tool which allows users to examine how county level turnout and margin changes would affect the outcome. But in the meantime, the Talarico campaign needs to focus on the urban areas, especially in Houston, the Metroplex and the Valley.
[1] https://www.pewresearch.org/race-and-ethnicity/2012/11/07/latino-voters-in-the-2012-election/
[2] https://time.com/3923128/donald-trump-announcement-speech/
[3] https://texaspolitics.utexas.edu/blog/trends-latino-attitudes-texas-foreshadowed-trump’s-gains-2024
[4] https://data.census.gov/profile
[AM1]Removing sentence and shifting focus on large counties to “urban areas” section

Leave a comment